ChartTalk: Navigating the NIFTY IT Index: A Promising Opportunity Amidst Consolidation
On June 21st, the NIFTY reached new all-time highs, sparking optimism in the market. However, it soon slipped into a broad-ranged consolidation, dampening the spirits of investors. Despite this, the IT sector had been displaying encouraging signs of improvement in its relative momentum against the broader markets. Here, we’ll delve into the performance of the NIFTY IT Index, its technical structure, and the potential opportunities it presents for investors in the short to medium term.
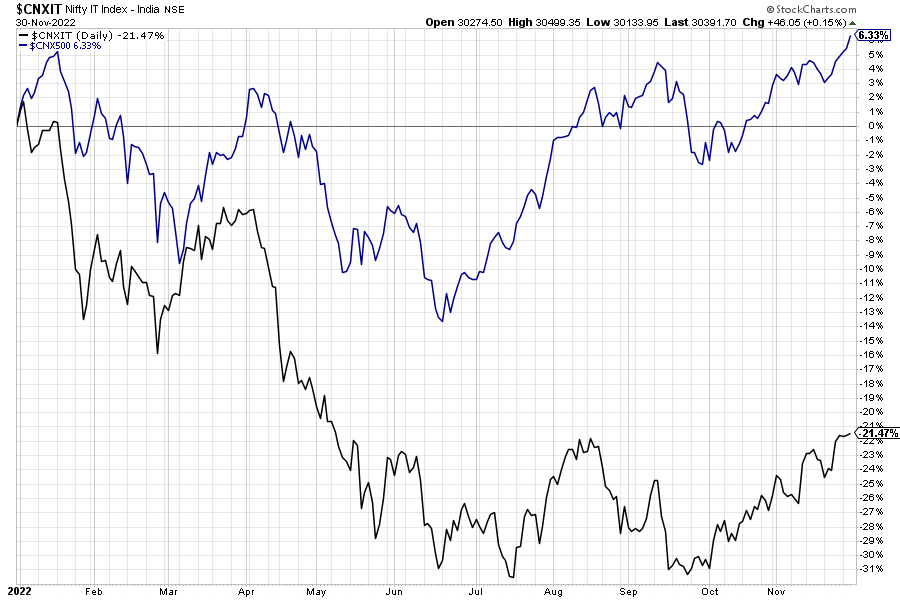
NIFTY IT Index Performance:
Despite the NIFTY’s fresh lifetime highs, the NIFTY IT Index lags behind, still far from the record highs seen in January 2022. Its relative underperformance has been evident for several quarters, with a YTD return of just 3.30% compared to the NIFTY’s 8.51% gains during the same period. Weak earnings and guidance from Infosys disrupted the IT Index’s performance. However, this presents a favorable chance for investors to selectively pick stocks from the IT sector for short to medium-term gains.
ChartTalk – This Is Free!!
Our FREE technical newsletter – Get actionable and profit-generating trade ideas in your mailbox.
Technical View:
The NIFTY IT Index has displayed a strong and consistent uptrend since the COVID lows in March 2020. It reached its peak at 39446 in January 2022, marking an impressive rally of over 255% from its lows. Subsequently, a classical reversal pattern of Head and Shoulders emerged, with the IT Index violating the neckline in April 2022, leading to its underperformance in the market.
The IT Index experienced a retracement of 30% from its highs, with multiple tests of the support level at 26180. At present, it remains in a sideways consolidation phase, with resistance noted at 31565.
Weekly and Daily Chart Indicators:
On the weekly chart, the NIFTY IT Index has hovered around the crucial 50-week moving average (MA), indicating a cautious market outlook. However, the daily chart offers some positive momentum within the broader consolidation range. A noteworthy development is the occurrence of a “golden crossover” on the daily chart, where the 50-day moving average crossed above the 200-day moving average. This suggests a shift toward bullish sentiment in the short term.

Reversing Underperformance:
For the NIFTY IT Index to regain its leading position and outperform the broader market, two critical technical conditions must be met. Firstly, it needs to enter the Improving Quadrant on the Relative Rotation Graph (RRG), which will happen when the JdK Momentum crosses above 100. This would signal the beginning of a phase of relative outperformance for the IT sector. Secondly, the IT Index must break above the current resistance level at 31565, signifying a breakout from the ongoing consolidation phase.
Promising Prospects Ahead:
Once these technical conditions are fulfilled, we can expect the IT sector to regain its leading position and deliver alpha-generating returns on investment. This resurgence would benefit both large-cap and mid-cap IT stocks, providing investors with a promising opportunity to capitalize on the sector’s potential.
Despite recent underperformance, the NIFTY IT Index shows promise for investors with its technical structure and positive momentum indicators. A potential breakout from the current consolidation phase and entry into the Improving Quadrant on the RRG could herald a new era of outperformance for the IT sector. As always, investors should conduct thorough research and consider their risk tolerance before making any investment decisions in the market.
-Foram Chheda, CMT