Chart Talk: This Small-Cap Stock Can Be Added To Your Portfolio

Chart Talk: This Small-Cap Stock Can Be Added To Your Portfolio

It certainly pays to keep things simple. While technically analyzing a stock, you don’t always need to have your chart look like a rainbow, comprising multiple colors, and with a plethora of indicators and oscillators plotted on it. Most of the time, a simple chart throws in a lot more information than something that looks too complex. It is often said, and it is true as well, that over-analysis kills!

It is a basic tenet of technical analysis that the longer the time that a pattern takes to evolve on a chart, the more reliable and potent that pattern becomes. This holds true for any technical pattern regardless of whether it is a continuation pattern or trend reversal pattern. There is some generalization involved; for example, one would see rounding tops being more distinctly found in large-cap stocks or rounding bottoms being found more commonly in smaller stocks, but most of the patterns are found across the universe.

ChartTalk – This Is Free!!

Our FREE technical newsletter – Get actionable and profit-generating trade ideas in your mailbox.

* indicates required

The interesting part is that this rectangle pattern has taken a year to develop. If we look at a higher time frame (Weekly) charts, a similar pattern appears. This makes this pattern fractal in nature. This is evidenced by the weekly chart below.

A similar rectangle pattern appears making the one that appears on the daily chart fractal in nature. Besides this, all other indicators support the attempted breakout. The OBV on both the timeframes has marked a high indicating participation of volumes in the breakout. The RS line against the broader markets remains in a strong uptrend and remains above the 50-period MA.

The stock remains in the leading quadrant of the RRG; on the weekly timeframe, it is inside the improving quadrant indicating that a phase of its relative outperformance against the broader markets has likely begun.

The week has not ended yet but in all likelihood, this breakout may remain valid and in place. If this happens, then going by the price measurement implications, the stock may go on to test 775 to 800 levels if held for at least a medium-term horizon resulting in a price appreciation of ~15% from the current levels.

Foram Chheda, CMT

ChartTalk: Expect A Major Trend Reversal In This Stock

ChartTalk: Expect A Major Trend Reversal In This Stock

The equity markets have been jittery over the past few weeks; the front-line Index NIFTY50 failed to sustain a breakout after moving past the previous lifetime high. After marking an incremental high, the index slipped below the breakout point. However, the broader markets stayed highly stock-specific; many stocks that had grossly underperformed the markets, in general, are showing signs of some structural reversal of the trend. This insurance aggregator is showing some classical signs of reversal of the downtrend and is in process of confirming its bottom in place.

ChartTalk – This Is Free!!

Our FREE technical newsletter – Get actionable and profit-generating trade ideas in your mailbox.

* indicates required

PB Fintech Ltd (POLICYBZR) has a relatively short listing history. The stock made its high on its listing day near 1470 in November 2021; it had a terrible performance since then. By November of this year, the stock had ended up losing over 76% of its value. However, following the marking of lows between 356-375 during October-November of this year, the stock has made a strong attempt to reverse its downtrend.

Strong classical signs have emerged on the charts indicating a bottom in place for this stock.

While the stock was moving sideways in the 356-375 zone, an exponential increase in volumes was seen in November. Volumes analysis would mean that any exponential increase in volume may hint at a potential bottom for the stock and may mark a point of reversal. The confirmation of this indication came from a sharp rise in the On-Balance Volume (OBV) during the same period; this confirmed that there was a strong accumulation of the stock at the lower levels.

The Relative Strength improved as well; the RS line (compared with the broad market index NIFTY500) reversed its downtrend and started inching higher eventually crossing above the 50-period MA.

While the stock was still marking incremental lower lows, the RSI had already sharted showing strong positive divergence against the price by marking higher bottoms.

If the current technical structure resolves on the expected lines, the stock may confirm a reversal of the trend; subsequently, it has the potential to test 550 levels and that would mean a price appreciation of 15% from the current levels. Any move below the 470 level would invalidate this technical setup.

Foram Chheda, CMT

ChartTalk: Expect Leadership From This Sector As It May Confirm A Reversal

ChartTalk: Expect Leadership From This Sector As It May Confirm A Reversal

Despite the ever-depreciating Rupee, this sector has been showing gross relative underperformance against the broader markets for many months. In fact, globally as well, the technology sector has taken a severe beating in this calendar year; this was evident in the YTD performance of NASDAQ which has been one of the worst-performing indexes globally.

A similar trend was seen in the domestic markets as well. From the sectoral point of view, the NIFTY IT index has been one of the laggards this calendar year.

ChartTalk – This Is Free!!

Our FREE technical newsletter – Get actionable and profit-generating trade ideas in your mailbox.

* indicates required

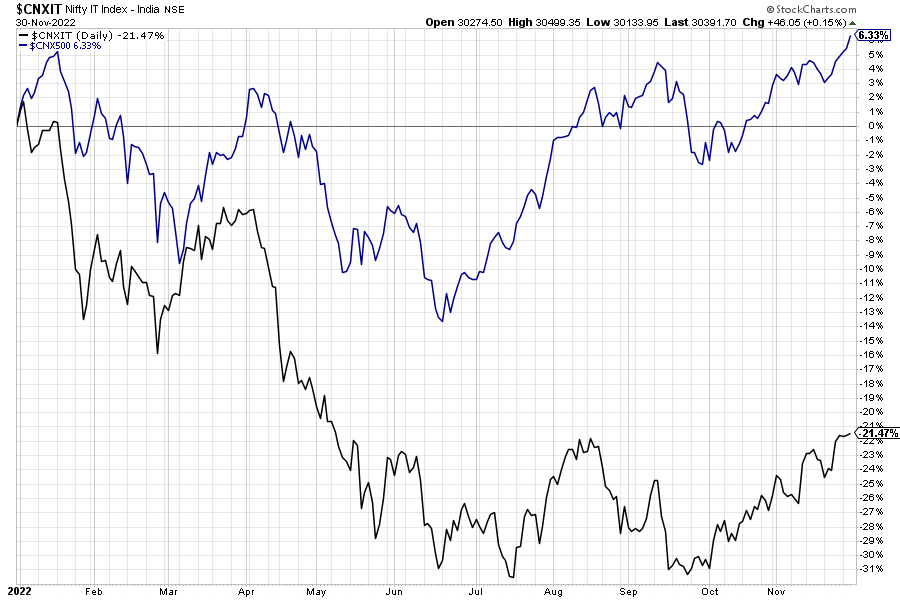
Speaking on YTD terms, while the broader NIFTY500 index has returned a positive return of 6.33%, the NIFTY IT Index has returned a negative return of (-21.47%) on a similar timeframe.

However, some strong signs are seen appearing on the NIFTY IT Sector Index that show that it may be in a process of confirming its reversal of trend in the near term.

The NIFTY IT index topped out in early January of this year when it marked its high at 39157.75. Following a brief consolidation just below that level, it saw a sharp decline and slipped under correction. It went on to lose over 12900 points (-32.89%) from its peak until it attempted to find its support near 26450 levels in June.

What followed after that was a technical pullback, and until October of this year, NIFTY IT Index tested this level on several occasions. This led to the formation of multiple support points near 26450 levels. It was this October onward that the NIFTY IT index started to inch higher; it moved above the 50-, and the 100-DMA in the process, and presently it is seen making attempts to move past the 200-DMA which is presently at 30239,

From other pieces of technical evidence present on the chart, there is a high possibility that the IT Index will eventually break above the 200-DMA; if this happens, it would confirm an end and subsequent reversal of the downtrend that this sector witnessed over the past many months.

The current levels also mark a classical double top; any move above 200-DMA will also lead to a breakout from this formation. RSI has marked a 14-period high which is bullish. The RS line against the broader markets has reversed its trajectory and remains above the 50-period MA.

The IT Sector is inside the leading quadrant of the RRG when benchmarked against the broader NIFTY 500 Index. Also on the weekly timeframe, this sector remains buoyantly placed inside the Improving quadrant while strongly maintaining its relative momentum against the broader markets.

Going ahead from here, so long as the NIFTY IT Index keeps its head above 29000 levels, it remains well-equipped to not only relatively outperform the broader markets in event of any consolidation but also provide strong leadership in the rising markets.

Foram Chheda, CMT

ChartTalk: This Sector Is Poised At A Crucial Juncture

ChartTalk: This Sector Is Poised At A Crucial Juncture

After showing a great outperformance until the middle of 2022, this key sector index of the Indian markets is showing signs of slowing down. The technical structure of charts shows that until a particular level is taken out, a potential top may be in place for this sector index. If we look at this in a different way, this sector will have to move past 28200 levels to resume its up move and reclaim its leadership. The sector in focus here is NIFTY Energy Index.

ChartTalk – This Is Free!!

Our FREE technical newsletter – Get actionable and profit-generating trade ideas TWICE in a month in your mailbox.

* indicates required

Following strong moves and equally strong relative performance against the broad market NIFTY500 index until April of this year, NIFTY Energy Index marked its high point at 29304.05. It showed a corrective retracement after that; it marked subsequent lower tops at 28100 and at 27233.

The recent move shows this sector index within a neutral pattern of a symmetrical triangle. From a technical perspective, it is important to know that this is a neutral pattern. Any directional move, unless accompanied by confirmation of the price action, must not be anticipated. This pattern can act as both reversals as well as a continuation pattern.

The Index is presently in the lagging quadrant of the RRG; it is likely to relatively underperform the broader markets. The RS line against the NIFTY500 index is in a downtrend when subjected to regular pattern analysis. It has also slipped below the 50-Week MA. RSI, though it remains natural against the price, is seen making lower tops.

Given this technical structure, it would be best to protect profits in this sector and take some money off the table. It would be prudent to wait for this technical pattern to resolve on either side before re-entering this group of stocks. 

Investors would always get a chance to re-enter energy stocks if the NIFTY Energy Index is able to move above 28200 levels. If it does not do that and slips below 50-Week MA 27507 and below on a closing basis, it would mean breaking down from this symmetrical triangle pattern. 

The present consolidation in this pattern is giving investors enough time to rejig their portfolios; it gives them the opportunity to move into those sectors that have their relative strength intact and sectors that are outperforming the general markets.

In the event of any resumption of the up move, an option to re-enter this pocket always remains upon the Nifty Energy Index moving past 28200 levels.

Foram Chheda, CMT

ChartTalk: Looking For A Medium Term Buy For Your Portfolio? Check Out This Stock

ChartTalk: Looking For A Medium Term Buy For Your Portfolio? Check Out This Stock

The Indian equity markets have stayed highly volatile throughout this calendar year; the calm was disrupted when geopolitical tensions broke out between Russia and Ukraine in February. After that, the equities across the world stayed highly volatile and under pressure due to a slew of interest rate hikes from the Federal Reserve which was followed by the central banks from the rest of the world including India’s RBI. Such an environment kept the equity markets on tenterhooks; however, India has remained one of the best relatively outperforming markets compared to its peers.

However, the most recent moves in the markets, regardless of the volatility that they were accompanied by, have created few good investment opportunities for the near-term horizon. May stocks from the broad market universe have shown signs of a potential reversal and some decent technical pullback. This generic injectable manufacturer is one such stock that may make a good addition to any investor’s portfolio for the medium term.

ChartTalk – This Is Free!!

Our FREE technical newsletter – Get actionable and profit-generating trade ideas TWICE in a month in your mailbox.

* indicates required

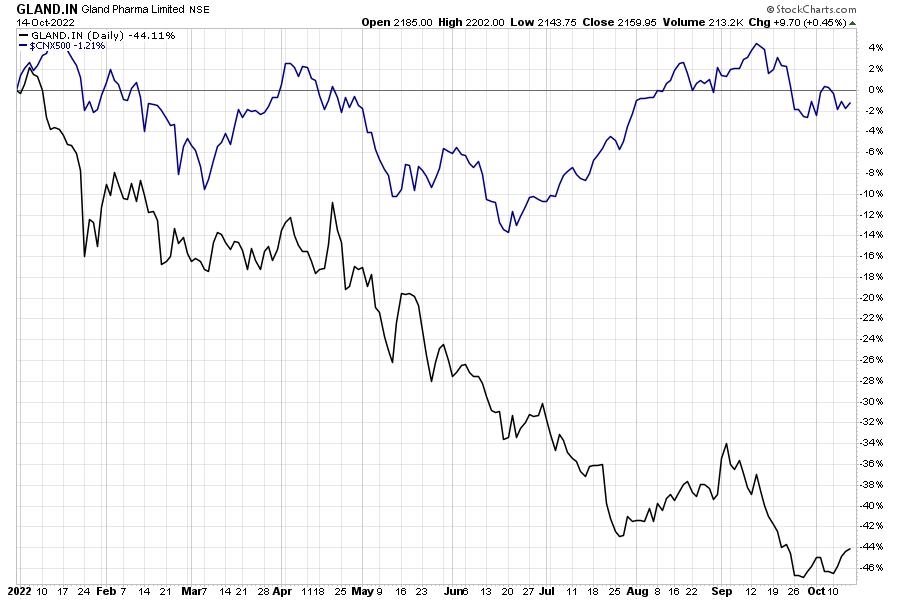
The above Relative comparison chart of Gland Pharma and the NIFTY 500 Index shows that the stock has grossly underperformed in the broader markets. While the NIFTY 500 Index has lost just 1.21% on a YTD basis, the GLAND stock has lost 44.11% over the same period.

After forming a high near 4350 and making a lower top thereafter at 4062, GLAND has remained under a sustained corrective decline. A few technical developments on the stock show that a potential bottom might be in place.

A bullish engulfing candle has emerged on the weekly charts; this has occurred after a significant decline. This makes this bullish engulfing candle a valid one and this marks a potential reversal point for the stock.

Importantly, the recent decline in price has come with a strong bullish divergence of the RSI against the price as RSI did not make lower bottom while the price did. The stock has rolled inside the improving quadrant of the RRG. This potentially puts an end to the relative underperformance of the stock.

The stock seems to have laid the ground for a significant technical pullback even if there is no major trend reversal in the offing. If the pullback happens on the expected lines, the stock may see itself testing 2600 levels. This translates into a potential return of ~20% from the current levels.

Foram Chheda, CMT

Is This A Good Time To Enter This Defence Engineering Stock?

Is This A Good Time To Enter This Defence Engineering Stock?

The defence equipments and engineering sector has been quite vibrant over the past couple of weeks and it is seen relatively outperforming the broader markets. This year it has already given a return of nearly 50% on average, while still leaving some more potential for an upside. After the banking, financials, media, textiles, and autos, it is now the defence equipments and engineering Industry stocks that are in the trend lately. This year some of the stocks like Mazagon Dock Shipbuilders Ltd, Cochin Shipyard and a large cap stock like Bharat Forge has moved up nearly 90%, 50%, and 34% from their lows respectively in this year.  

ChartTalk – This Is Free!!

Our FREE technical newsletter – Get actionable and profit-generating trade ideas TWICE in a month in your mailbox.

* indicates required

Paras Defence and Space Technologies Ltd (PARAS) is once such stock that holds potential for a significant upside. It has already moved up ~55% this year from its lows and has the potential to move higher by another 10% to 12% from the current levels.

Since Nov’21, the stock price of Paras Defence was in a corrective downtrend forming lower tops-lower bottoms until June this year. Finally, after forming a bottom at 523 levels, the stock price gradually changed its trend. It witnessed a gradual up-move and crossed above the 50-day moving average as well the 100-day moving average while it found resistance at the 200- day MA Technically speaking, when the stock price moves above the important moving averages it usually indicates that the underlying trend of the stock has turned bullish.  Following the up-move, the stock price faced difficulty in surpassing 680 levels which coincided with the downward sloping trendline resistance. This level acted as a strong resistance for the stock, and it retraced near the 50-day and 100-day moving averages which acted as a support level for the stock

After holding well above the 50-, and 100-day moving averages, the stock price resumed its move  move higher. By the end of August, the stock price not only broke out from the price pattern at 657 levels but also crossed above the 200-day moving average. Such a price action was accompanied by an exponential increase in volume which confirmed the potential upside in the stock.

Following the breakout, the stock price consolidated near 695-710 levels. While the stock shows a corrective retracement, the 50-day moving average has also crossed above 200-day moving average resulting in a Golden Crossover.

Presently, the stock price has retraced nearly 38.2% as per the Fibonacci retracement levels which invite buying opportunities at current levels. The likely up move in the price may see the stock testing 815 levels and this would mean a potential upside of ~10% for the stock. Any price moves below 685 should be considered to move out of the stock.

Foram Chheda, CMT